In the fast-paced world of e-commerce, understanding and leveraging data analytics is crucial for success. E-commerce analytics provide insights into customer behavior, sales performance, and marketing effectiveness, enabling businesses to make data-driven decisions. This comprehensive guide explores the essential metrics and tools for tracking e-commerce analytics, ensuring you stay ahead of the competition and maximize your online store’s potential.
Contents:
- Understanding E-commerce Analytics
- Sales Metrics
- Customer Metrics
- Website Metrics
- Marketing Metrics
- Operational Metrics
- Using Google Analytics for E-commerce
- Advanced Analytics Tools
- Integrating Analytics Tools
- Analyzing Sales Data
- Understanding Customer Behavior
- Optimizing Website Performance
- Evaluating Marketing Campaigns
- Managing Inventory and Operations
- Enhancing Customer Experience
- Data Privacy and Security
- Setting Up KPIs
- Building Data-Driven Strategies
- Challenges in E-commerce Analytics
- Future Trends in E-commerce Analytics
- Case Studies of Successful E-commerce Analytics Implementation
- FAQs
Understanding E-commerce Analytics
Definition and Importance
E-commerce analytics involve collecting, analyzing, and interpreting data from various aspects of an online store. This data helps businesses understand customer behavior, optimize marketing efforts, and improve overall performance. By leveraging analytics, e-commerce businesses can make informed decisions, identify growth opportunities, and stay competitive in a dynamic market.
Key Benefits
The key benefits of e-commerce analytics include enhanced customer insights, improved marketing strategies, optimized operations, increased sales, and better inventory management. Analytics enable businesses to tailor their offerings to customer needs, track the effectiveness of marketing campaigns, and streamline processes to enhance efficiency.
Sales Metrics
Revenue
Revenue is the total income generated from sales of goods or services. Tracking revenue helps businesses understand their overall financial health and assess the effectiveness of their sales strategies.

Average Order Value (AOV)
AOV is the average amount spent by a customer in a single transaction. Increasing AOV can boost revenue without the need to acquire new customers, often achieved through upselling and cross-selling strategies.
Conversion Rate
Conversion rate is the percentage of visitors who complete a desired action, such as making a purchase. A higher conversion rate indicates effective marketing and user experience efforts.
Sales by Product
Tracking sales by product helps identify top-performing items and those that may need more attention. This insight allows businesses to optimize their product offerings and inventory management.
Sales by Channel
Understanding which sales channels (e.g., website, social media, marketplaces) drive the most revenue can help allocate marketing resources more effectively and tailor strategies for each channel.
Customer Metrics
Customer Lifetime Value (CLV)
CLV measures the total revenue a business can expect from a customer throughout their relationship. High CLV indicates strong customer loyalty and effective retention strategies.
Customer Acquisition Cost (CAC)
CAC is the cost of acquiring a new customer. Lowering CAC while maintaining or increasing customer quality can significantly improve profitability.
Customer Retention Rate
Retention rate is the percentage of customers who continue to purchase over a given period. High retention rates indicate customer satisfaction and effective loyalty programs.
Churn Rate
Churn rate is the percentage of customers who stop purchasing from a business over a certain period. Reducing churn is crucial for maintaining a stable customer base and steady revenue.
New vs. Returning Customers
Analyzing the ratio of new to returning customers helps businesses understand the effectiveness of their acquisition and retention efforts. Balancing both is key to sustainable growth.
Website Metrics
Traffic Sources
Identifying where website traffic comes from (e.g., search engines, social media, email campaigns) helps businesses understand which channels are most effective in driving visitors.
Bounce Rate
Bounce rate is the percentage of visitors who leave the website after viewing only one page. A high bounce rate may indicate issues with site content, design, or user experience.
Page Views
Tracking the number of pages viewed by visitors provides insights into user engagement and content effectiveness. Higher page views often correlate with better user experience and content relevance.
Session Duration
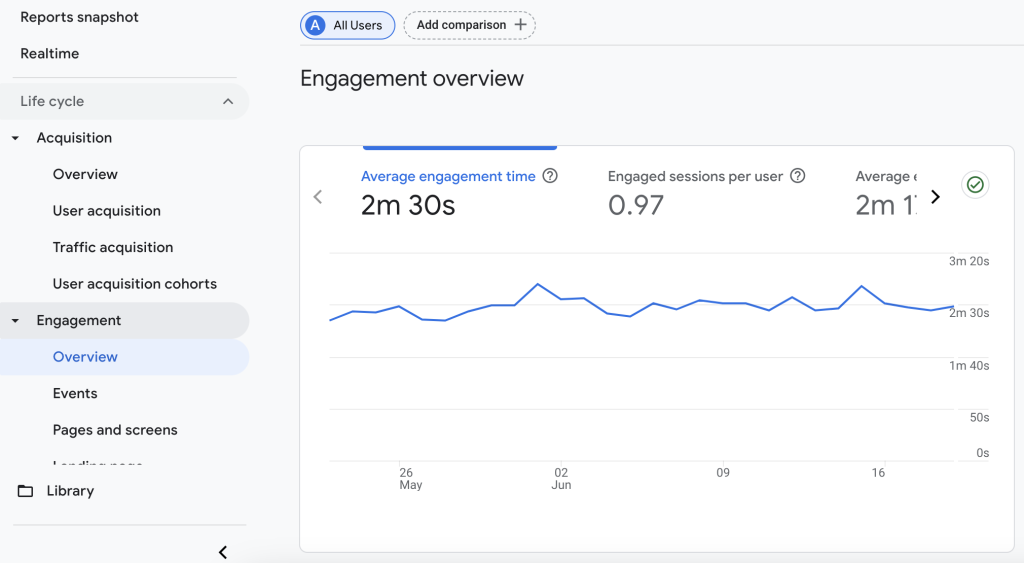
Session duration measures the average time visitors spend on the website. Longer session durations generally indicate higher user engagement and interest in the content.
Exit Rate
Exit rate is the percentage of visitors who leave the site from a particular page. Analyzing exit rates helps identify pages that may need improvement to retain visitors.
Marketing Metrics
Return on Advertising Spend (ROAS)
ROAS measures the revenue generated from advertising campaigns relative to their cost. Higher ROAS indicates more effective ad spend and better campaign performance.
Click-Through Rate (CTR)
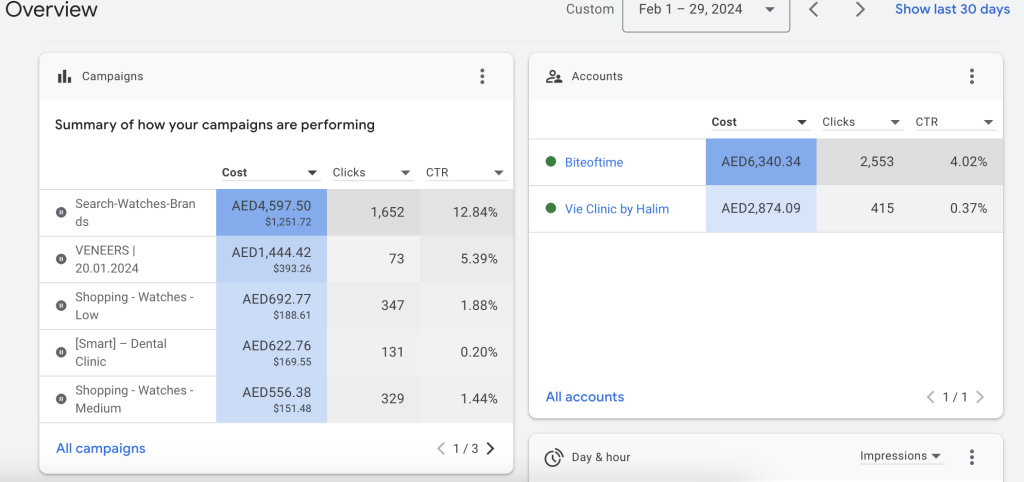
CTR is the percentage of people who click on an ad or link out of the total who view it. Higher CTR indicates more effective and engaging ads or content.
Cost Per Click (CPC)
CPC is the amount paid for each click on an ad. Lower CPC with higher CTR can improve the cost-efficiency of advertising campaigns.
Email Open Rates
Email open rates measure the percentage of recipients who open marketing emails. Higher open rates indicate more effective email subject lines and better audience targeting.
Social Media Engagement
Tracking likes, shares, comments, and other interactions on social media helps gauge the effectiveness of social media campaigns and overall brand presence.
Operational Metrics
Inventory Turnover Rate
Inventory turnover rate measures how quickly inventory is sold and replaced. Higher turnover rates indicate efficient inventory management and strong sales performance.
Order Fulfillment Time
Order fulfillment time is the average time taken to process and deliver orders. Shorter fulfillment times enhance customer satisfaction and reduce potential for returns.
Shipping Costs
Tracking shipping costs helps identify opportunities for cost reduction and more efficient logistics. Lower shipping costs can improve profit margins and customer satisfaction.
Return Rates
Return rates measure the percentage of products returned by customers. Lower return rates indicate better product quality and accurate descriptions, reducing costs and improving customer satisfaction.
Customer Support Response Time
The average time taken to respond to customer inquiries is crucial for maintaining customer satisfaction. Faster response times indicate efficient customer service operations.
Using Google Analytics for E-commerce
Setting Up Google Analytics
Setting up Google Analytics involves integrating tracking code into your website and configuring e-commerce settings to capture relevant data.
Key Reports
Key reports in Google Analytics include audience demographics, acquisition channels, behavior flow, and conversion tracking. These reports provide comprehensive insights into website performance and user behavior.

Enhanced E-commerce Features
Enhanced e-commerce features in Google Analytics offer advanced tracking of product performance, shopping behavior, and checkout process. Utilizing these features can provide deeper insights into customer interactions and sales funnel effectiveness.
Advanced Analytics Tools
Heatmaps
Heatmaps visualize where users click, scroll, and interact on your website. They help identify popular areas and potential issues with site navigation.
A/B Testing
A/B testing involves comparing two versions of a webpage or element to determine which performs better. This method helps optimize website elements and improve user experience.
Customer Segmentation
Customer segmentation involves dividing customers into groups based on behavior, demographics, or preferences. This allows for more targeted marketing and personalized experiences.
Predictive Analytics
Predictive analytics use historical data and machine learning to forecast future trends and customer behavior. These insights help businesses plan and optimize their strategies.
Business Intelligence (BI) Tools
BI tools integrate various data sources to provide comprehensive analytics and reporting. They enable businesses to make informed decisions based on a holistic view of their operations.
Integrating Analytics Tools
Choosing the Right Tools
Selecting the right analytics tools depends on your business needs, budget, and technical capabilities. Popular tools include Google Analytics, Adobe Analytics, and Mixpanel.
Integration Best Practices
Best practices for integrating analytics tools include ensuring data accuracy, maintaining data privacy, and regularly reviewing and updating configurations.
Data Synchronization
Data synchronization involves aligning data across different tools and platforms to ensure consistency and accuracy in reporting and analysis.
Analyzing Sales Data
Identifying Trends
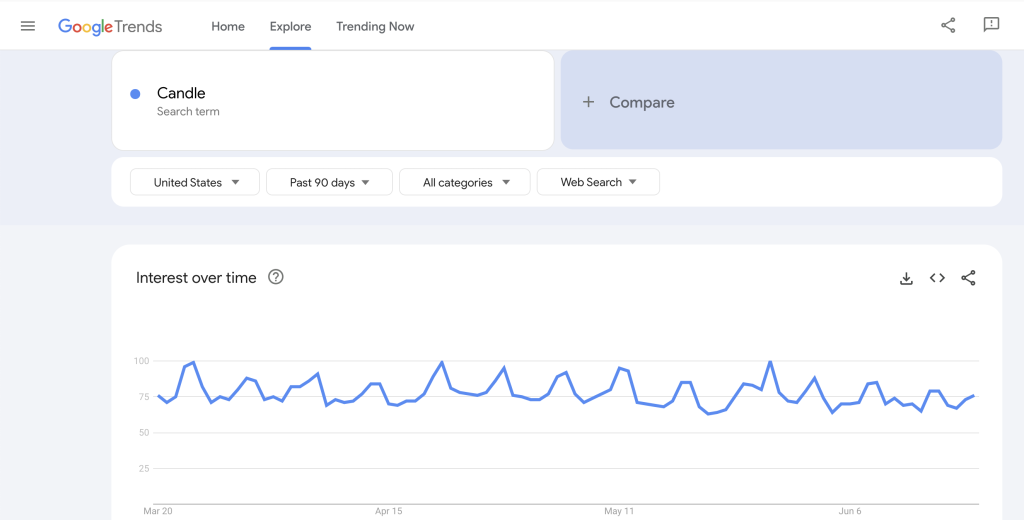
Analyzing sales data to identify trends helps businesses understand market dynamics, customer preferences, and seasonal variations. This information is crucial for strategic planning.
Seasonal Variations
Understanding seasonal variations in sales helps businesses plan inventory, marketing campaigns, and promotions to capitalize on peak periods.
Sales Forecasting
Sales forecasting involves predicting future sales based on historical data and market trends. Accurate forecasting helps businesses plan production, inventory, and staffing needs.
Product Performance Analysis
Evaluating product performance helps identify bestsellers and underperforming items. This analysis informs inventory management, marketing strategies, and product development.
Understanding Customer Behavior
Purchase Patterns
Analyzing purchase patterns helps identify customer preferences, buying frequency, and potential opportunities for upselling and cross-selling.
Browsing Behavior
Tracking browsing behavior provides insights into how customers navigate your website, which pages they visit, and where they drop off.
Customer Journey Mapping
Mapping the customer journey involves visualizing the steps customers take from initial contact to purchase. This helps identify touchpoints and opportunities for improvement.
Personalization Strategies
Personalization strategies involve tailoring content, offers, and experiences to individual customer preferences, enhancing engagement and conversion rates.
Optimizing Website Performance
Improving Load Times
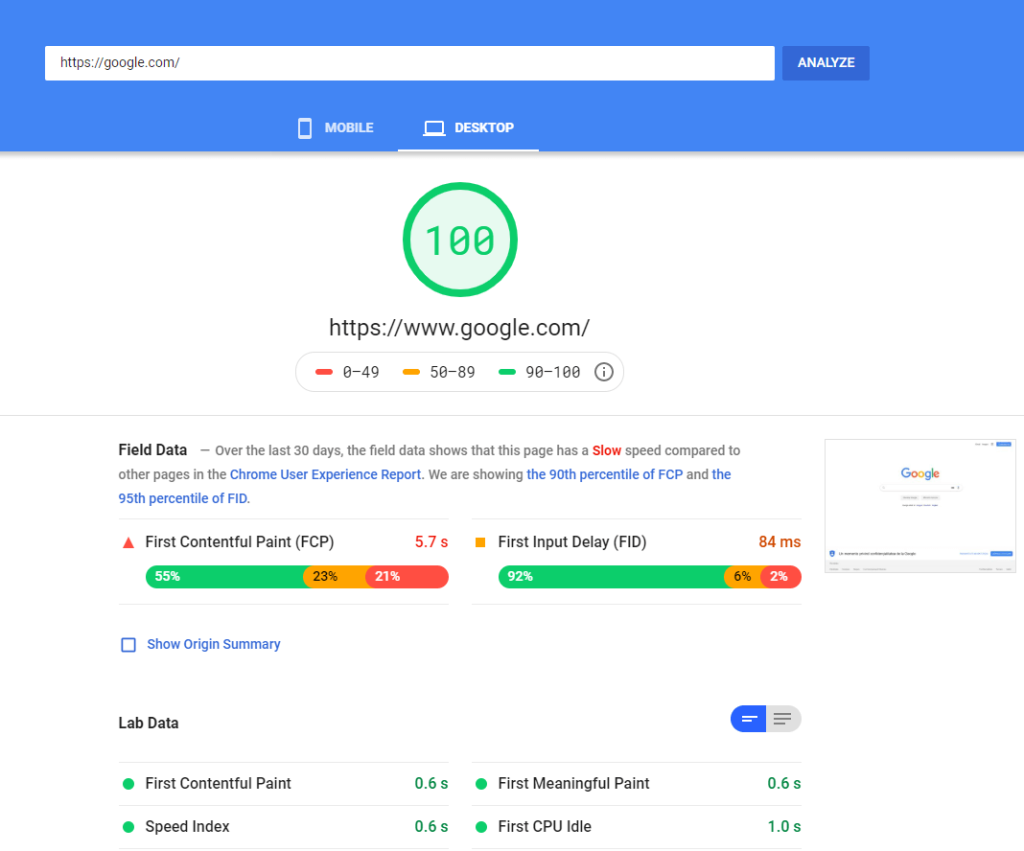
Faster load times improve user experience and can positively impact conversion rates. Techniques include optimizing images, leveraging caching, and minimizing server response times.
Mobile Optimization
Ensuring your website is optimized for mobile devices is crucial as more customers shop via smartphones and tablets. This includes responsive design and mobile-friendly navigation.
Enhancing User Experience
Improving user experience involves creating a seamless, intuitive, and engaging website. This includes easy navigation, clear calls to action, and visually appealing design.
Reducing Cart Abandonment
Reducing cart abandonment involves addressing common reasons customers leave without purchasing, such as high shipping costs, complicated checkout processes, and lack of payment options.
Evaluating Marketing Campaigns
Attribution Models
Attribution models help determine which marketing efforts contribute most to conversions. Understanding attribution helps allocate marketing budgets more effectively.
Measuring Campaign Success
Measuring the success of marketing campaigns involves tracking key metrics such as ROAS, CTR, and conversion rates. Regular analysis helps optimize ongoing and future campaigns.
Optimizing Ad Spend
Optimizing ad spend involves analyzing the performance of different advertising channels and adjusting budgets to maximize ROI.
Tracking Influencer Marketing
Tracking the impact of influencer marketing involves monitoring metrics such as engagement, reach, and conversions. This helps assess the effectiveness of influencer partnerships.
Managing Inventory and Operations
Demand Forecasting
Demand forecasting involves predicting future demand based on historical data and market trends. Accurate forecasting helps optimize inventory levels and reduce stockouts.
Inventory Optimization
Optimizing inventory involves maintaining the right balance of stock to meet customer demand without overstocking. Techniques include just-in-time inventory and automated reordering.
Streamlining Operations
Streamlining operations involves improving processes to enhance efficiency and reduce costs. This includes automating repetitive tasks and optimizing supply chain management.
Reducing Waste
Reducing waste involves minimizing excess inventory, packaging, and energy consumption. Sustainable practices can improve profitability and appeal to environmentally conscious consumers.

Enhancing Customer Experience
Personalization
Personalizing the customer experience involves tailoring content, offers, and interactions to individual preferences, enhancing satisfaction and loyalty.
Customer Feedback
Collecting and analyzing customer feedback helps identify areas for improvement and validate business decisions. Regular feedback loops ensure continuous enhancement of the customer experience.
Loyalty Programs
Loyalty programs reward repeat customers and encourage continued engagement. Effective programs offer valuable incentives and foster strong customer relationships.
User-generated Content
Encouraging user-generated content, such as reviews and social media posts, enhances credibility and provides valuable insights into customer preferences and experiences.
Data Privacy and Security
GDPR Compliance
Ensuring compliance with GDPR involves protecting customer data and providing transparency about data collection and usage practices.
Data Protection Strategies
Implementing robust data protection strategies, including encryption and access controls, safeguards sensitive information and maintains customer trust.
Secure Payment Gateways
Using secure payment gateways protects customer payment information and reduces the risk of fraud.
Customer Data Management
Effective customer data management involves securely storing, processing, and analyzing data to provide insights while ensuring privacy and compliance with regulations.
Setting Up KPIs
Defining Key Performance Indicators
Defining KPIs involves identifying the most important metrics for measuring business success. These should align with overall business goals and provide actionable insights.
Aligning KPIs with Business Goals
Aligning KPIs with business goals ensures that analytics efforts support strategic objectives and drive meaningful outcomes.
Regular Monitoring and Reporting
Regularly monitoring and reporting on KPIs helps track progress, identify issues, and make data-driven decisions to achieve business goals.
Building Data-Driven Strategies
Data-Driven Decision Making
Data-driven decision making involves using analytics to inform business strategies and operational decisions, ensuring they are based on objective insights.
Implementing Insights
Implementing insights involves translating data findings into actionable steps that improve performance and achieve business objectives.
Measuring Impact
Measuring the impact of implemented changes helps determine their effectiveness and guides future strategies.
Continuous Improvement
Continuous improvement involves regularly reviewing and refining strategies based on new data and insights, ensuring ongoing optimization and growth.
Challenges in E-commerce Analytics
Data Overload
Managing data overload involves prioritizing key metrics and using tools to filter and analyze relevant information.
Data Accuracy
Ensuring data accuracy involves regularly auditing data sources and processes to maintain reliable insights.
Integrating Multiple Data Sources
Integrating multiple data sources involves consolidating information from various platforms to provide a comprehensive view of performance.
Keeping Up with Trends
Staying current with trends involves regularly reviewing industry developments and adapting strategies to leverage new opportunities.
Future Trends in E-commerce Analytics
AI and Machine Learning
AI and machine learning enhance analytics by providing predictive insights, automating processes, and personalizing customer experiences.

Real-Time Analytics
Real-time analytics offer immediate insights into performance, enabling quick decision-making and responsive strategies.
Augmented Reality
Augmented reality enhances the shopping experience by allowing customers to visualize products in their environment before purchase.
Voice Commerce
Voice commerce leverages voice-activated devices to streamline shopping experiences, offering new opportunities for customer engagement and sales.
Case Studies of Successful E-commerce Analytics Implementation
Notable Examples
Examining notable examples of successful e-commerce analytics implementation provides valuable insights and best practices.
Key Takeaways
Identifying key takeaways from case studies helps apply successful strategies to your own business.
Lessons Learned
Understanding lessons learned from others’ experiences helps avoid common pitfalls and achieve better outcomes.
FAQs
What are the essential metrics to track in e-commerce analytics?
How can I improve my conversion rate?
What tools are best for e-commerce analytics?
How can I reduce cart abandonment?
Why is customer lifetime value important?
How do I ensure data privacy in e-commerce analytics?
E-commerce analytics are vital for understanding and improving various aspects of your online business. By tracking essential metrics and leveraging advanced tools, you can optimize your operations, enhance customer experiences, and drive growth. Staying informed about the latest trends and continuously refining your strategies will ensure sustained success in the competitive e-commerce landscape.


